March 2019 Loudoun County Market Trends Report: Inventory Remains Tight While Prices Stabilize
Overview
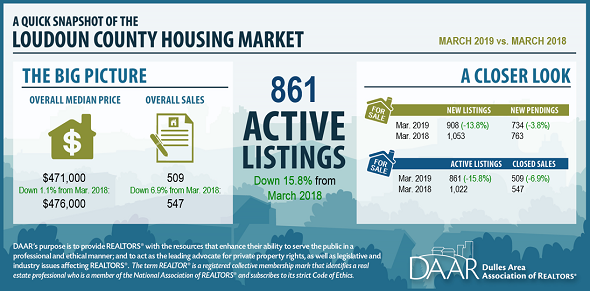
- Inventory continues to decline, with new active listings providing no sign of future easing. New active listings declined 13.8 percent year-over-year, from 1,053 in March 2018 to 908 in March 2019.
- There were only 861 active listings in Loudoun County in March 2019. The number of active listings was 15.8 percent fewer active listings than in March 2018 and 53.2 percent fewer than in March 2015.
- The inventory tightening impacted all areas of Loudoun County, the number of active listings declined in every zip code analyzed.
- Unlike February, new listings do not provide any signal that inventory will ease. New active listings declined 13.8 percent from March 2018 to March 2019, the third consecutive March decline.
- Tight inventory is likely the origin of declines in the number of closed sales and new pending sales.
- The number of closed sales declined 6.9 percent in March, the first March decline since 2016.
- The number of new pending sales also declined, decreasing 3.8 percent from the year prior.
- The tight inventory is also likely the underlying force decreasing the median days on market (DOM)and increasing the average sales price to original list price (SP to OLP) ratio.
- The median DOM of sold homes in Loudoun County continued to decrease and was recorded at just 22 days in March.
- The SP to OLP ratio increased to 98.9%, sellers in Loudoun County are receiving nearly 100 percent of their original asking price.
- Despite the tight inventory, the median sales price of sold homes in Loudoun County declined 1.1 percent year-over-year in March.
- The decrease in the median sales price of sold homes was the result of a decline in the median sales price of detached homes. The median sales prices of townhomes and condos both increased from March 2018 to March 2019.
For more information, read the full report.