February 2023: Market Indicators Report
Click here for the full February 2023 Loudoun County Market Indicators Report for the Dulles Area Association of REALTORS® by Virginia REALTORS®.
Key Market Trends
Sales activity down from a year ago in the Loudoun County housing market.
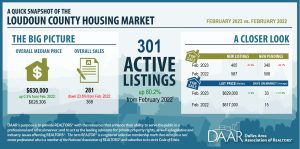
In the county, there were 281 sales in February, down 23.6% from last year, which is 87 fewer sales. The largest drop in sales this month was in Ashburn zip code 20148 with 27 fewer sales (-42.9%) and Sterling zip code 20165 with 12 fewer sales compared to last February (-44.4%). Chantilly zip code 20152 had four more sales than the previous year (+19.0%), the largest increase in the county this month.
Pending sales activity continued to cool through February.
There were 340 pending sales in Loudoun County this month, 168 fewer pending sales than a year prior, representing a 33.1% drop. Ashburn zip code 20148 had 37 fewer pending sales than last February (-44.0%), followed by Sterling zip code 20165 (-52.9%) and Aldie zip code 20105 (-37.5%).
Home prices rose in some local markets and fell in others this month in Loudoun County.
The countywide median price was $630,000 in February, inching up $1,695 or 0.3% from the previous year. At the local level, sharpest jump in median price occurred in Leesburg zip code 20175 with prices up by $152,778 (+26.1%) and Lovettsville zip code 20180 with a price increase of $71,500 (+12.1%). Prices fell the sharpest in Aldie zip code 20105 (-25.1%) and Chantilly zip code 20152 (-7.0%).
Supply of active listings continues to build up, but fewer new listings are coming on the market.
There were 301 active listings on the market at the end of February in Loudoun County, an 80.2% jump, which is 134 more active listings than a year ago. There were 405 new listings countywide in February, 182 fewer new listings than a year ago, which is a 31% drop.
Data Note: The housing market data for all jurisdictions in Virginia was re-benchmarked in November 2021. Please note that Market Indicator Reports released prior to November 2021 were produced using the prior data vintage and may not tie to reports that use the current data set for some metrics. We recommend using the current reports for historical comparative analysis.